
BerryTrackCount: Detection–Tracking–Counting Pipeline
BerryDet
BerryDet is a scale-sensitive blueberry detector built on YOLO11 for recognizing flowers and fruits across multiple phenological stages. Because many targets occupy only 1–2% of a high-resolution frame, BerryDet combines MSSC with Slicing Aided Hyper Inference (SAHI). SAHI divides high-resolution orchard images into smaller overlapping slices for inference and merges the resulting detections, improving the visibility and localization of small targets.
Micro-target Spatial–Semantic Coupling Module (MSSC): Small blueberry targets require fine spatial cues for accurate localization and strong semantic responses for reliable phenological classification. However, repeated downsampling and feature compression can weaken local texture, contour, and positional information. To address this issue, MSSC splits the input features into semantic and spatial branches, estimates complementary channel and spatial weights, and then aggregates the two branches. This design preserves position-sensitive semantic representations and improves the detection of small flowers and fruits in complex orchard scenes.
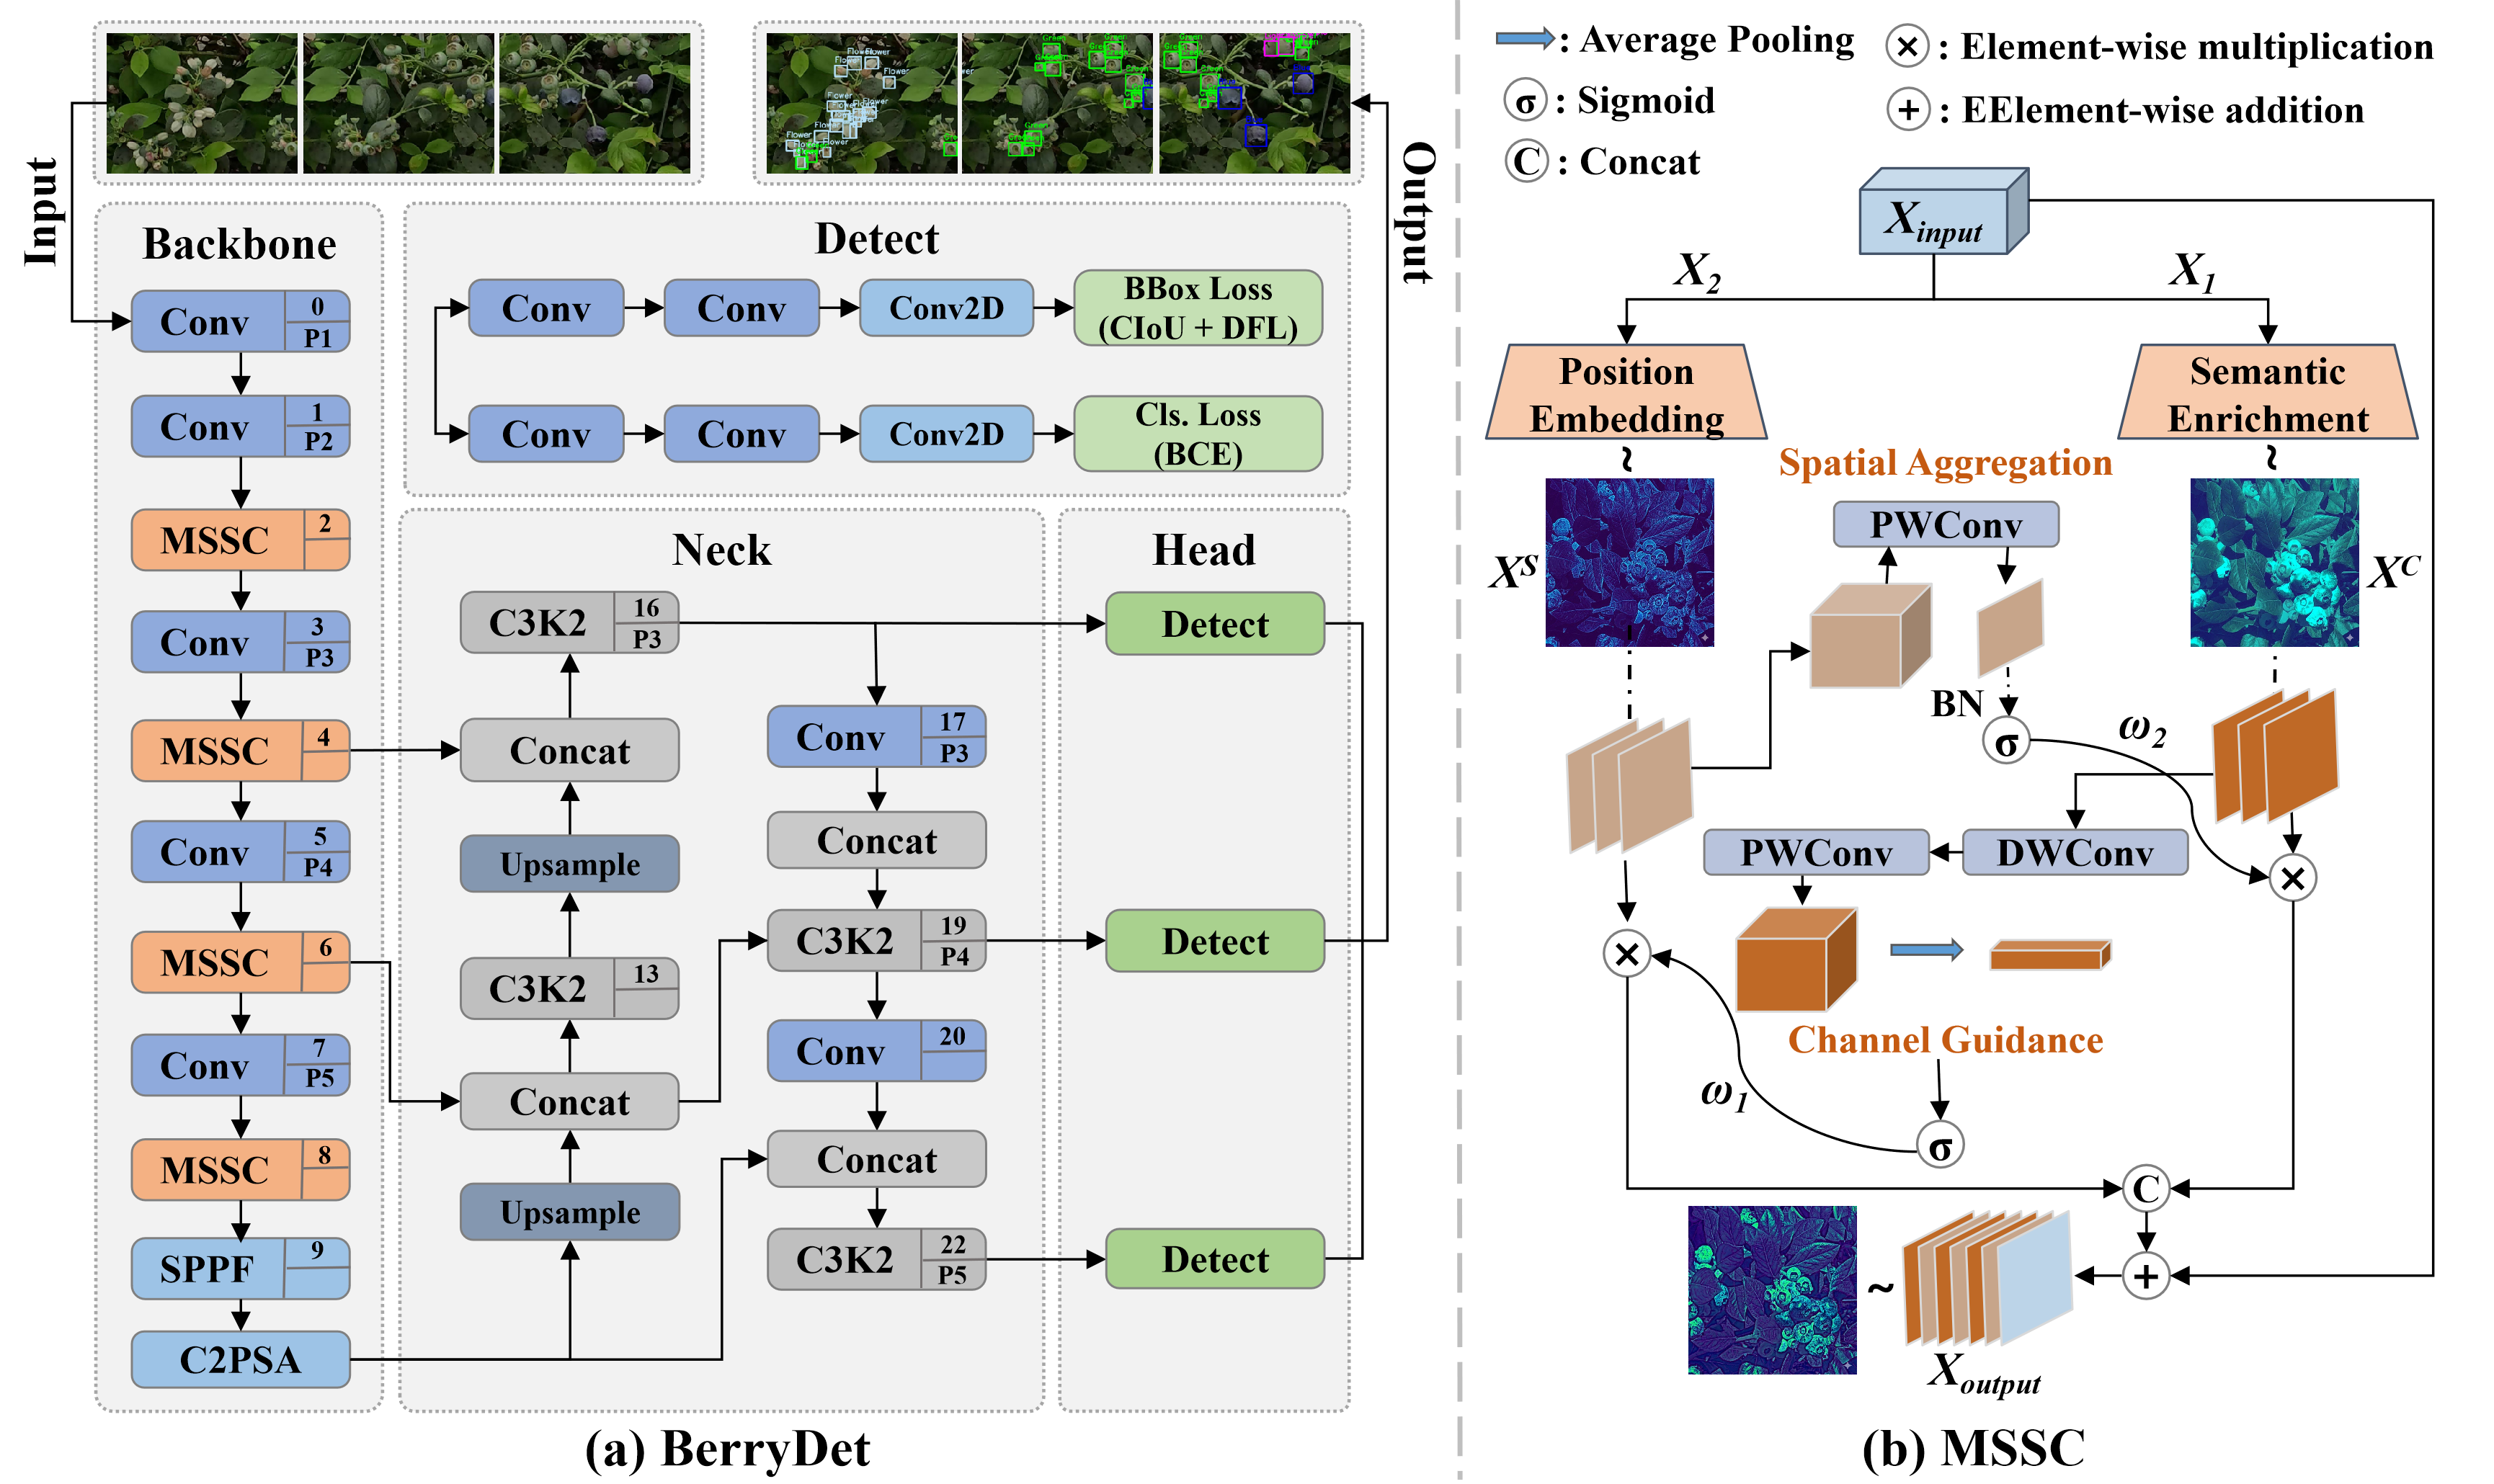
Figure 1. Architecture of BerryDet and the Micro-target Spatial--Semantic Coupling Module (MSSC). (a) BerryDet embeds MSSC into the backbone to enhance small-object representation while retaining the feature-fusion neck and decoupled detection head. (b) MSSC splits input features into semantic and spatial branches, estimates channel and spatial weights, and aggregates the two branches to preserve position-sensitive semantic representations.
BerryTracker
BerryTracker extends Deep OC-SORT for dense and visually homogeneous blueberry targets. Its first association stage fuses VCM-CIoU geometric similarity, Velocity Direction Consistency (VDC), and TCAR appearance similarity for global Hungarian matching. A second Observation-Centric Recovery stage matches unmatched tracks and detections using their last valid observations and VCM-CIoU, reducing fragmentation after short occlusions.
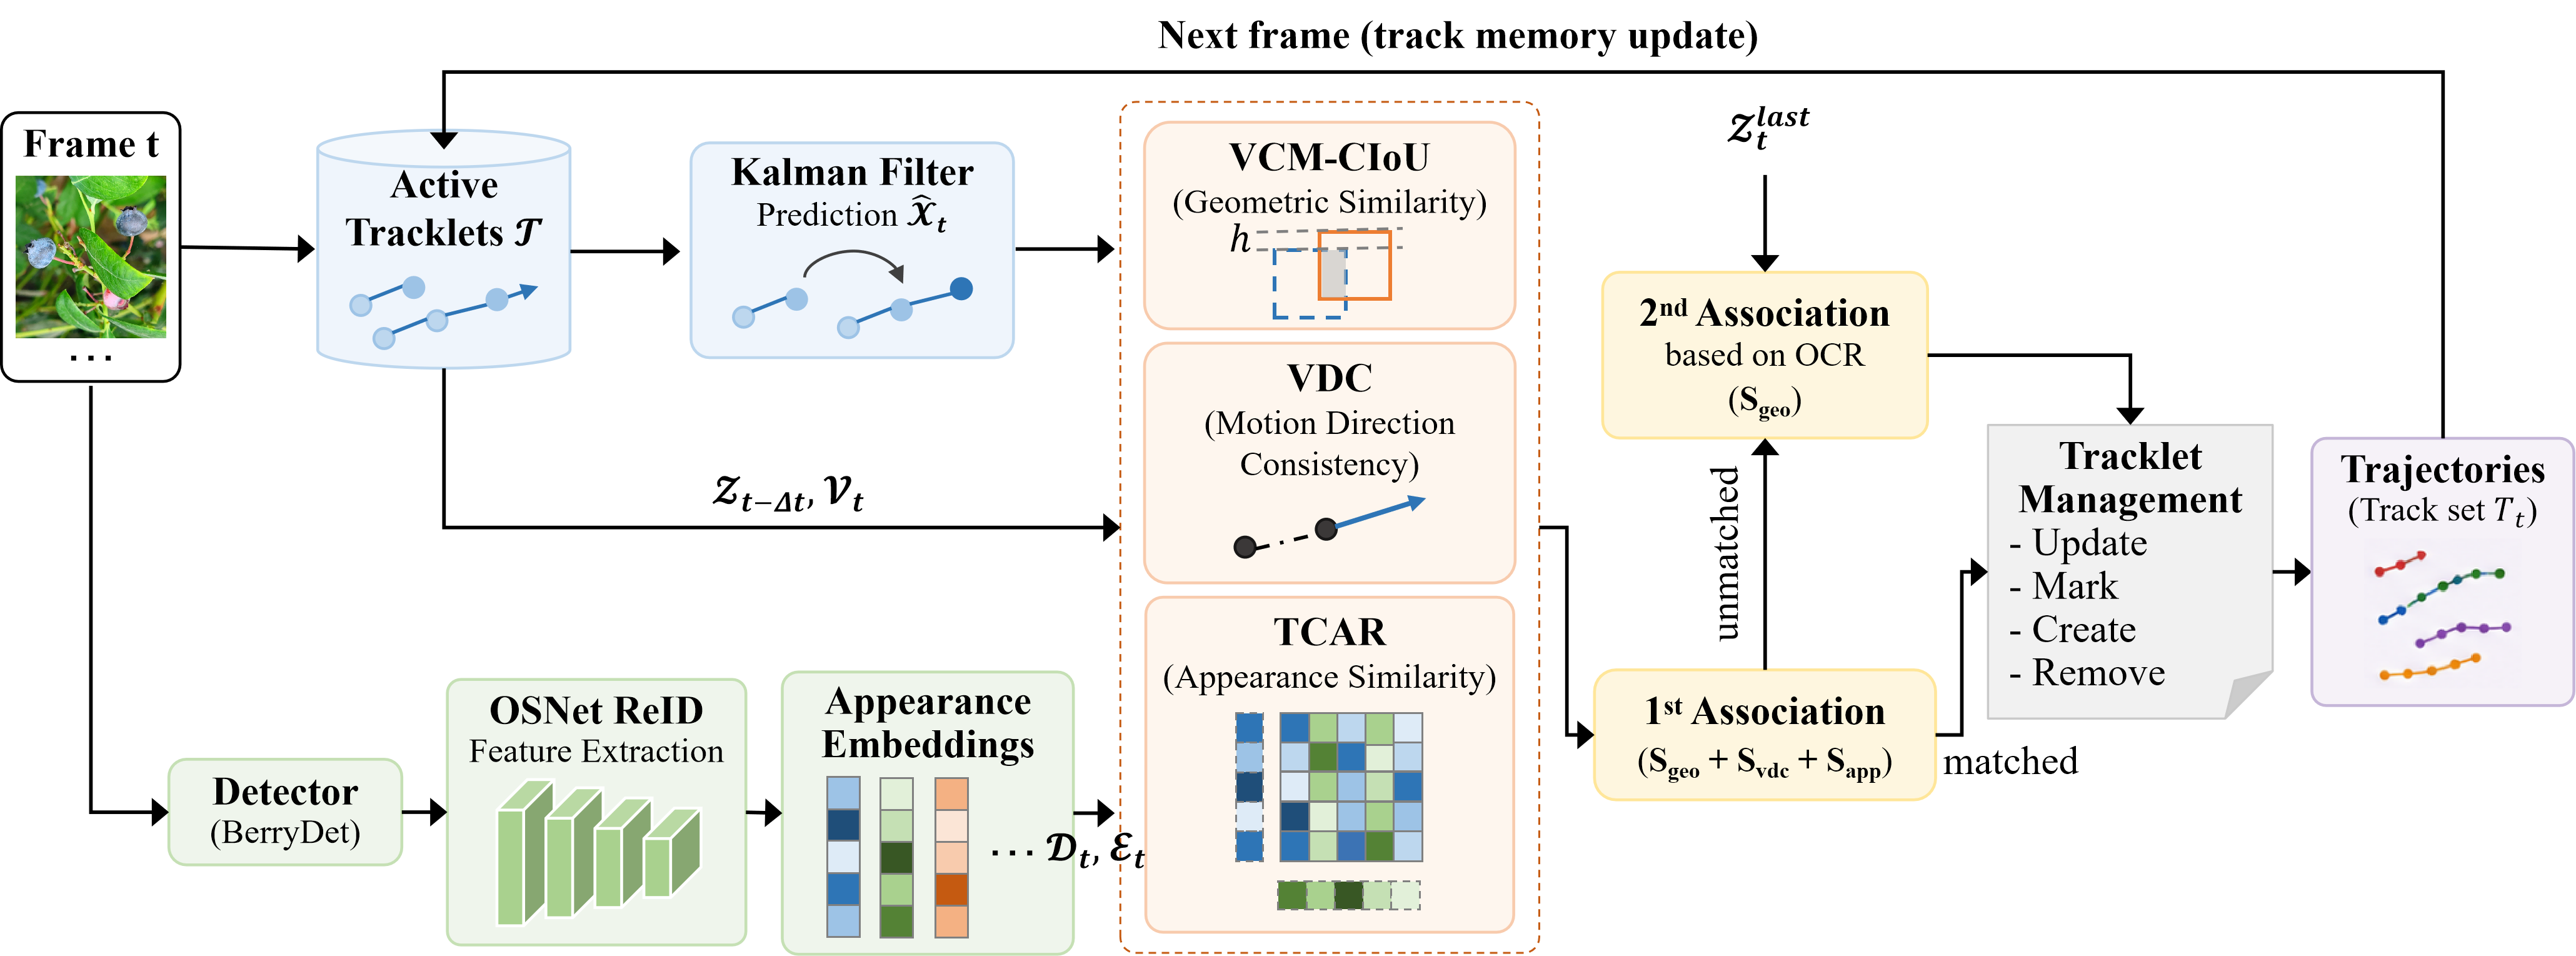
Figure 2. Tracking framework of BerryTracker. The first-stage association fuses VCM-CIoU geometric similarity, VDC motion consistency, and TCAR-based appearance similarity for global matching. The second-stage Observation-Centric Recovery (OCR) matching uses the last valid observations of unmatched tracks and constructs the cost matrix using only VCM-CIoU to reduce short-term trajectory fragmentation.
Vertical-Consistency Modulated Complete IoU (VCM-CIoU): Dense blueberry clusters can produce similar IoU scores for different track–detection pairs, particularly when adjacent fruits are vertically stacked or partially occluded. Although CIoU considers overlap, center distance, and aspect-ratio consistency, it does not explicitly model vertical consistency. VCM-CIoU introduces a one-dimensional vertical-overlap constraint into the normalized CIoU similarity. By jointly considering overlap area, center deviation, aspect ratio, and height consistency, it improves geometric separability and suppresses erroneous associations in dense fruit clusters.
Trajectory-Conditioned Appearance Reconstruction (TCAR): Conventional ReID features may be weakly identity-specific when nearby blueberries share color, shape, and texture. TCAR reconstructs tracklet and detection embeddings through bidirectional cross-attention, then evaluates enhanced appearance similarity. Combined with vertical-consistency-aware geometry, this makes the association cost more discriminative for overlapping targets.
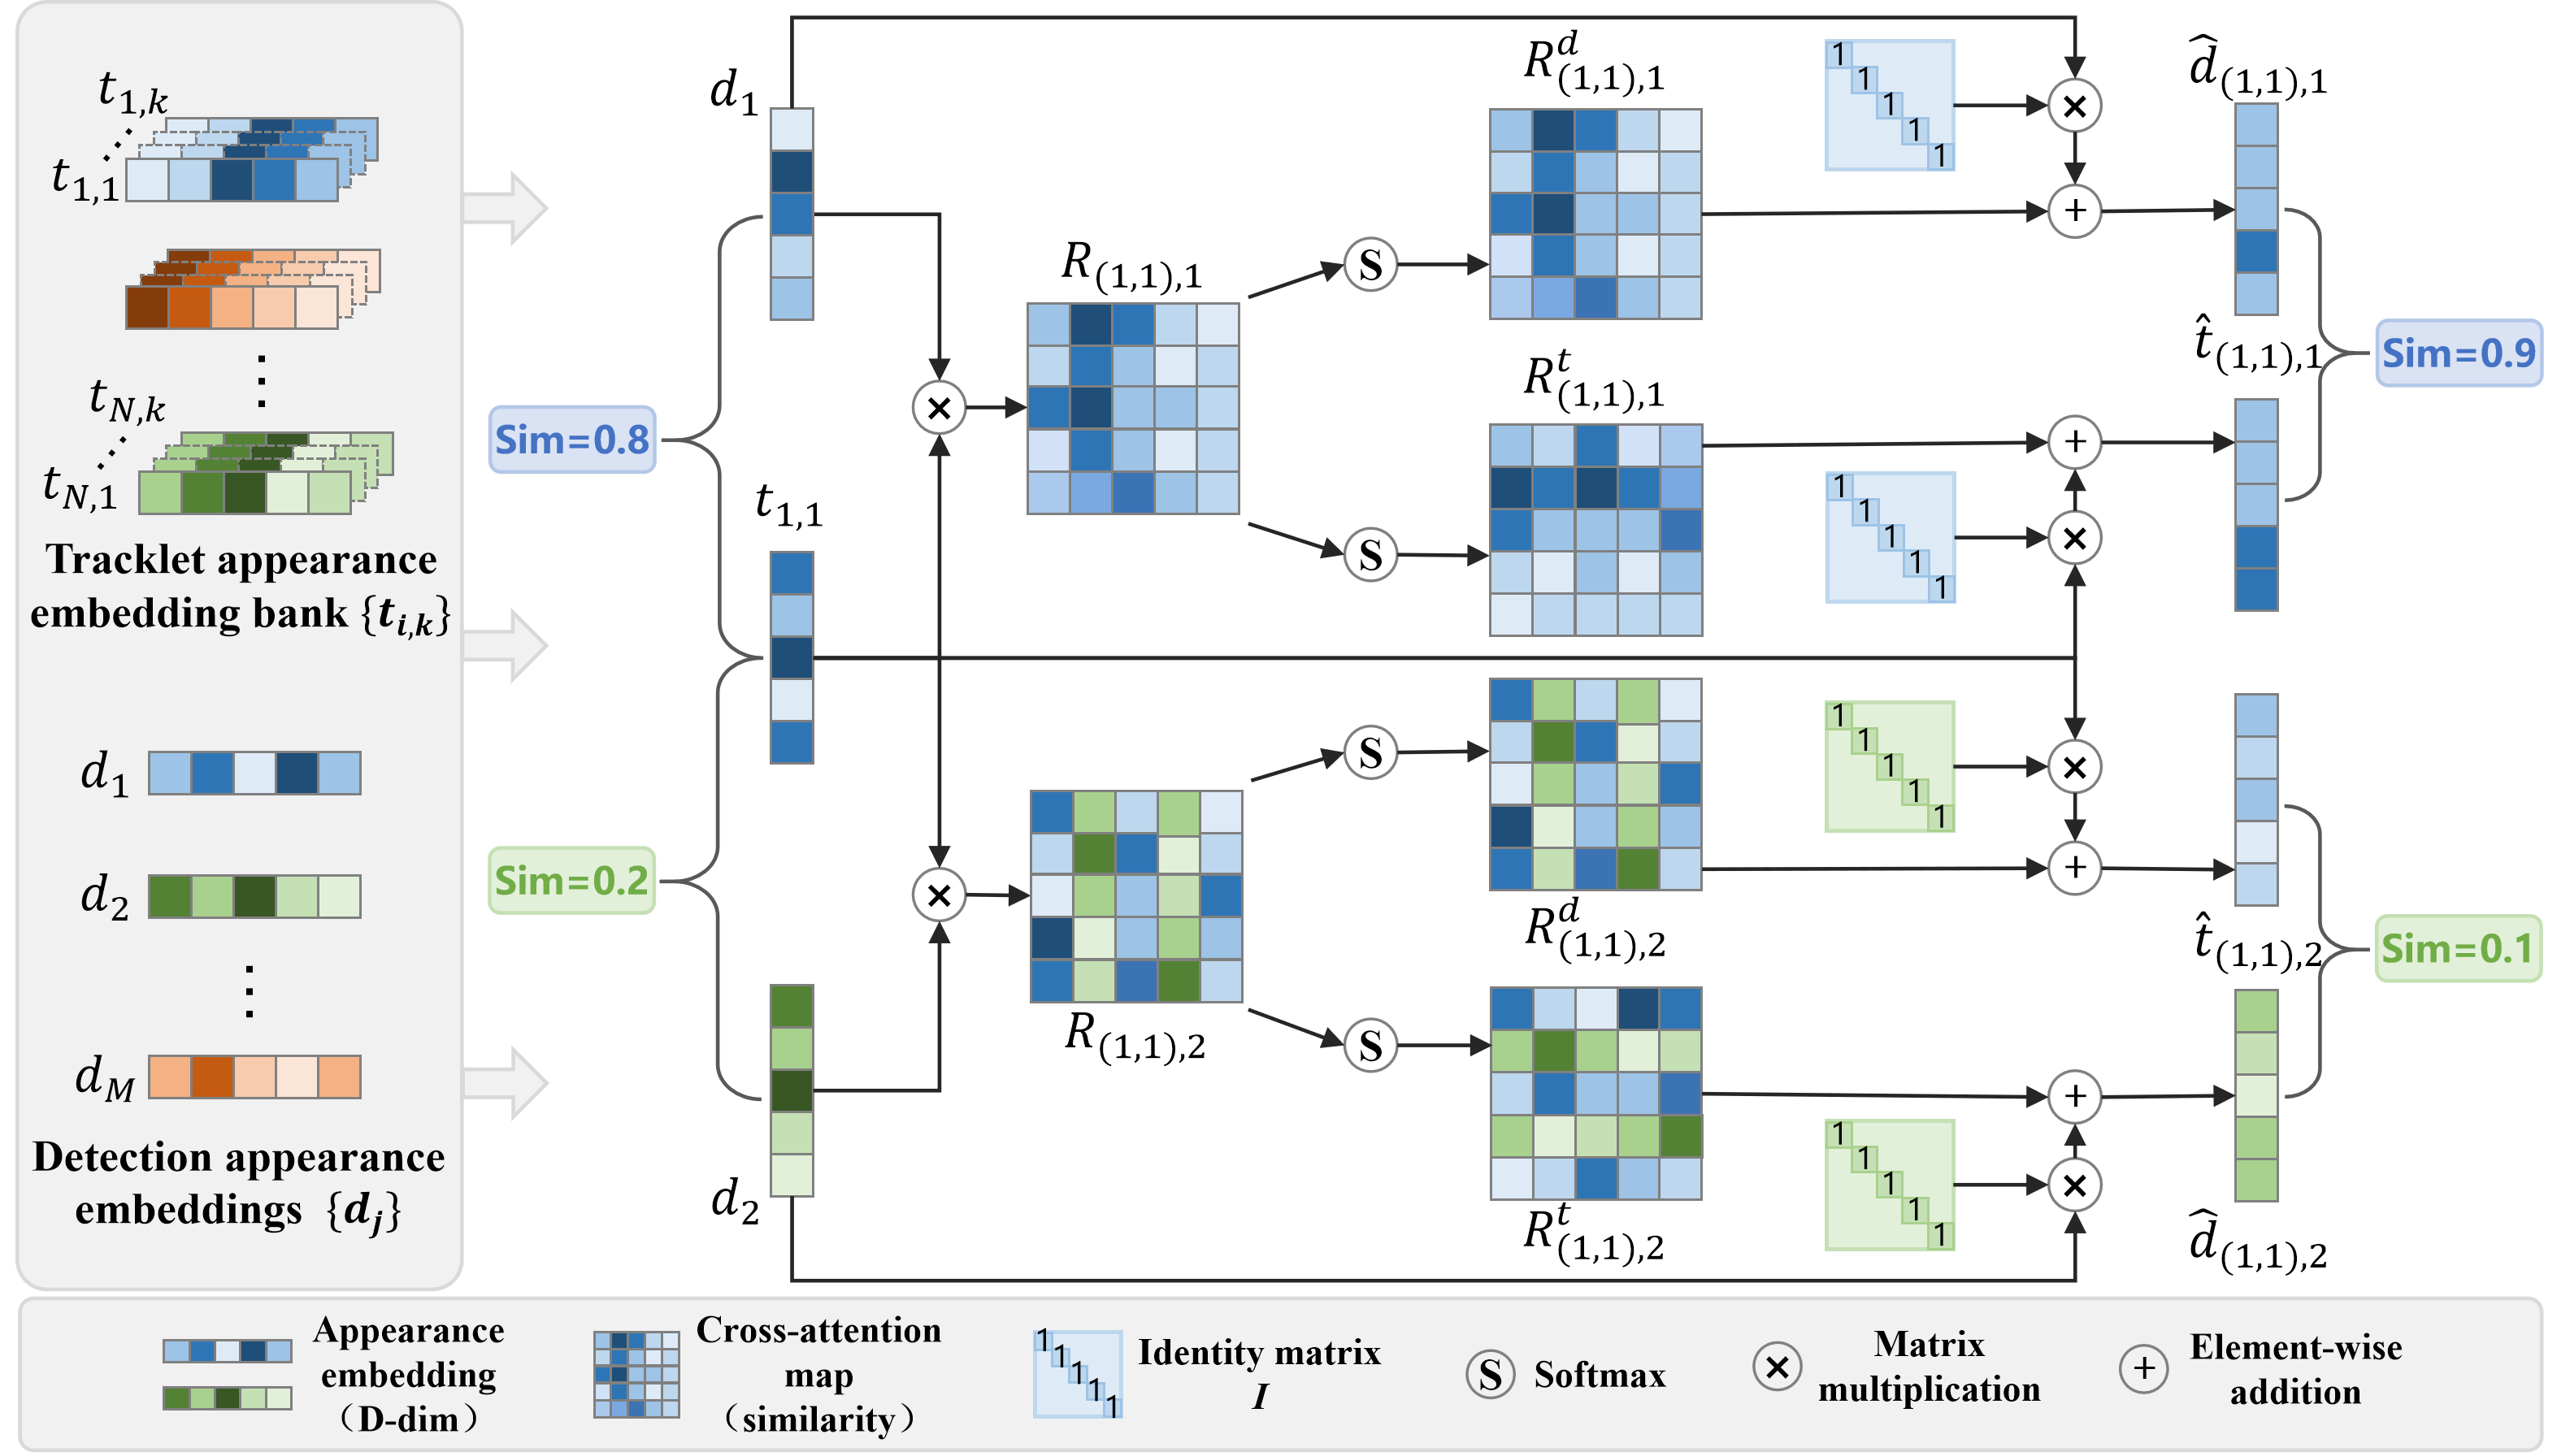
Figure 3. Trajectory-Conditioned Appearance Reconstruction (TCAR). TCAR reconstructs tracklet and detection embeddings through bidirectional cross-attention and computes enhanced appearance similarity for identity association.
Phenology-specific Trajectory-Gated Counting (PTGC)
Direct ID accumulation overcounts fragmented trajectories, while a single counting line is sensitive to bounding-box jitter. PTGC places a narrow vertical region near the frame center and counts each trajectory only on its first entry. The 8% region used in the experiments provides spatial tolerance while trajectory-level gating suppresses repeated triggers.
Results
On 20 blueberry MOT test sequences, BerryTracker combined with PTGC achieved the best counting accuracy of 93.48%, exceeding Deep OC-SORT with PTGC by 1.93 percentage points. It also produced the lowest overall error, with a GEH of 1.22 and RMSE of 30.11. The fitted relation between predicted and ground-truth counts was y = 0.93x + 34.66, with an R2 of 0.966.
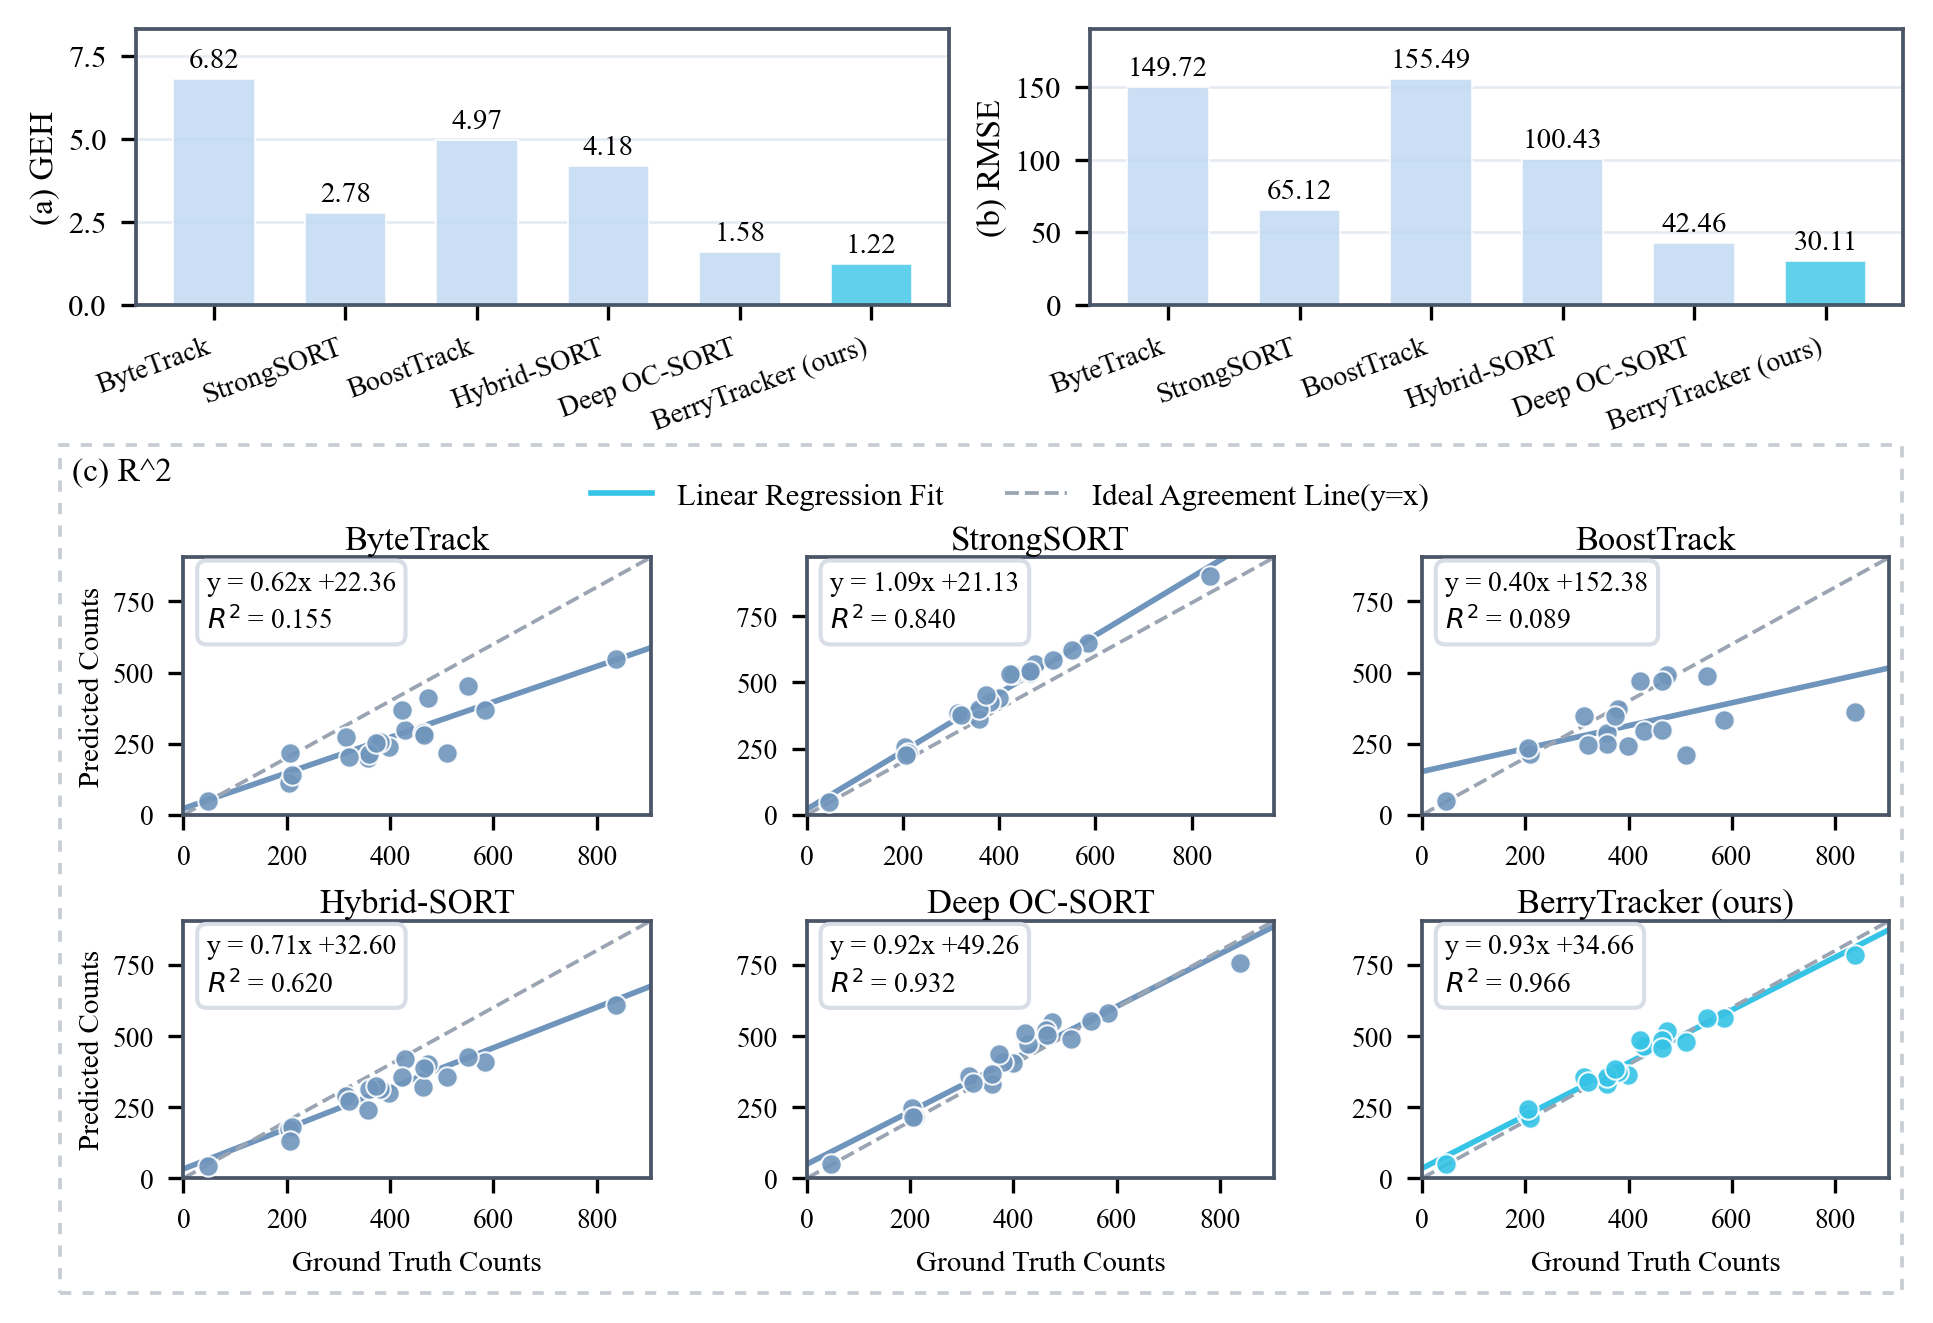
Figure 4. Overall counting performance of different tracking algorithms under the PTGC strategy. (a) GEH. (b) RMSE. (c) Regression results between predicted and ground-truth counts.
PTGC achieved class-specific R2 values of 0.978, 0.968, 0.991, and 0.981 for Flower, Green, Light Purple, and Blue, respectively. The corresponding RMSE values were 8.72, 19.30, 4.01, and 7.21.
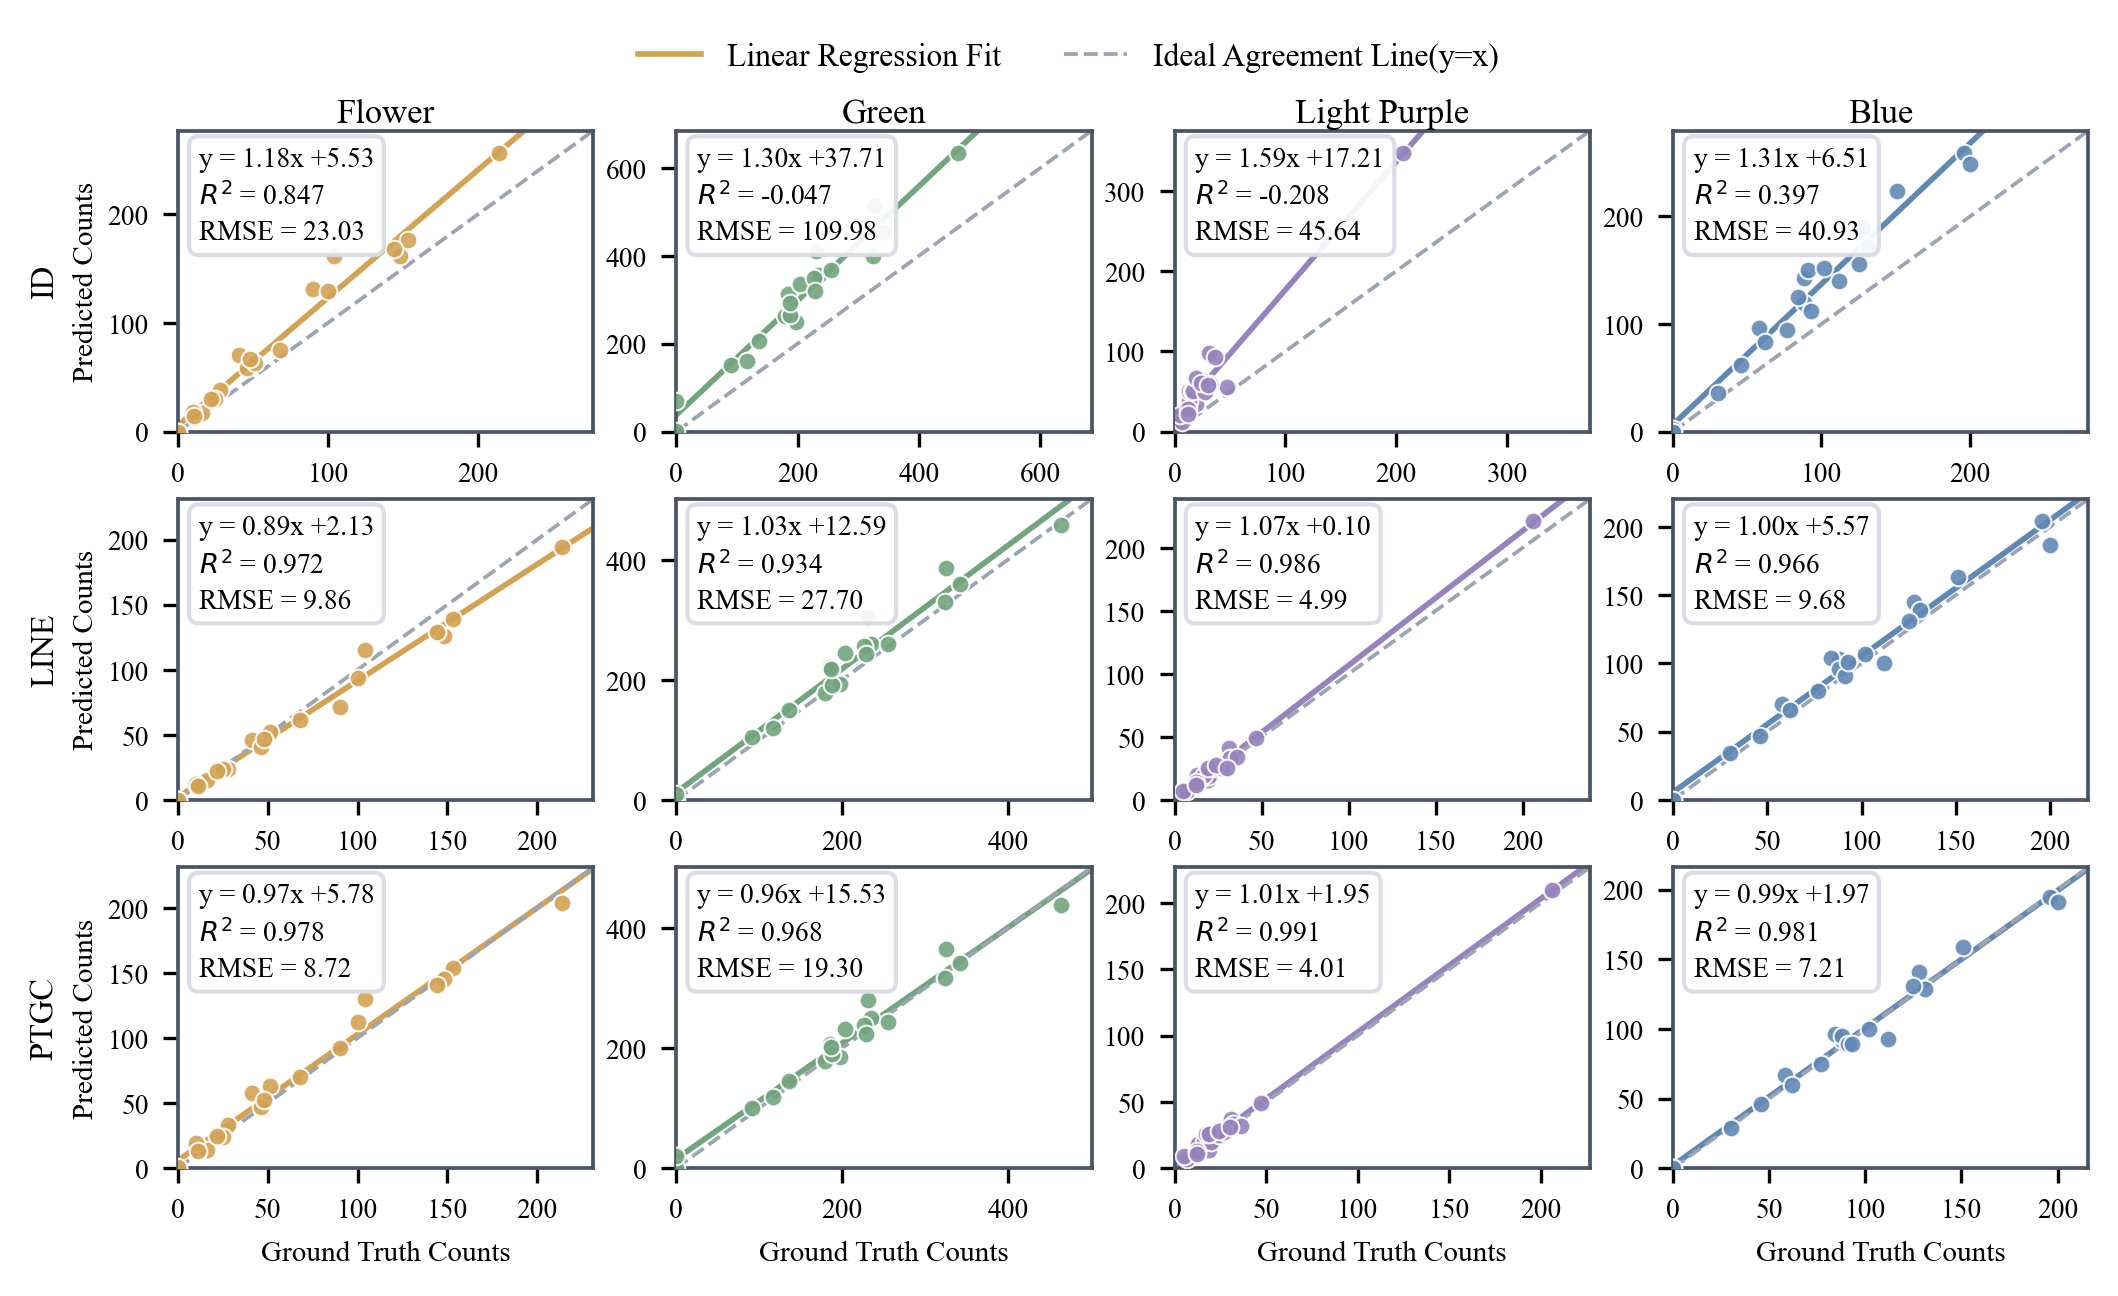
Figure 5. Regression analysis of BerryTracker counting results across phenological categories and counting strategies. Each subplot compares predicted counts with ground-truth counts for Flower, Green, Light Purple, and Blue; the solid line denotes the fitted regression line, and the dashed line denotes the ideal agreement line y=x.
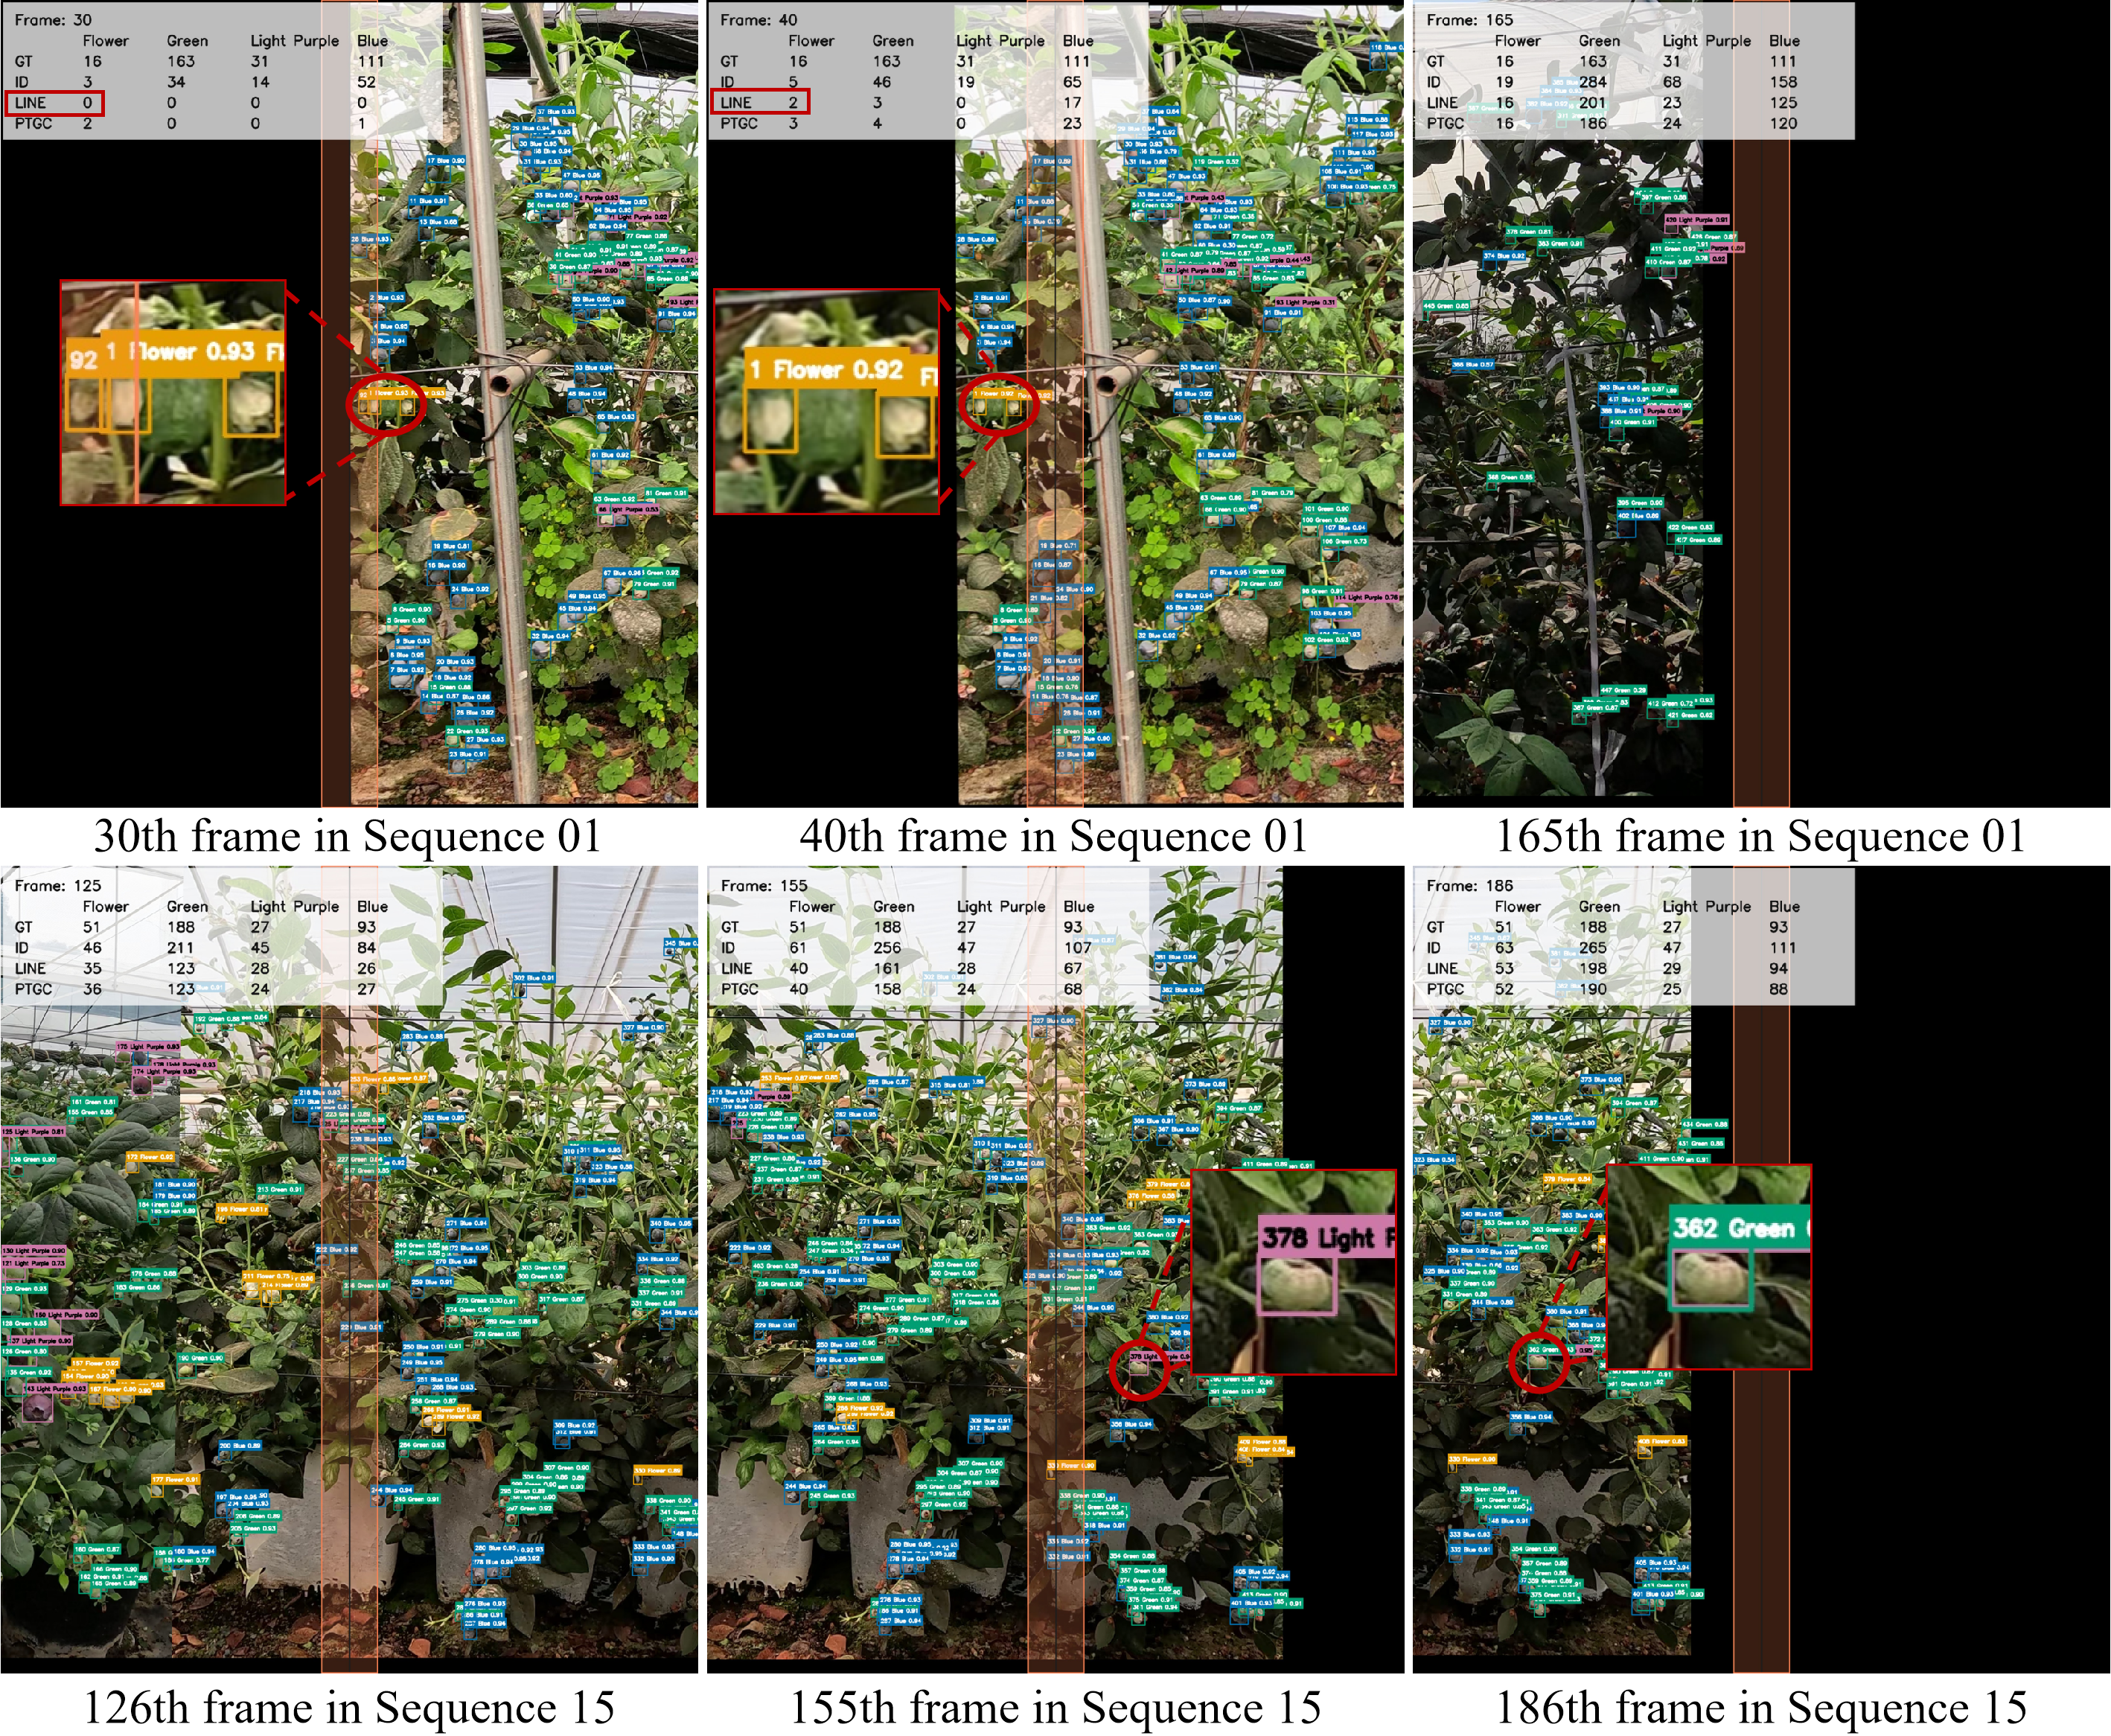
Figure 6. Visual counting results of the blueberry video counting framework on test sequences 01 and 15. Red circles indicate representative counting errors, including missed counts near frame boundaries and cross-frame class changes.